

WISIT – The WifOR Sustainability Impact Tool
Register now for the beta version
In their sustainability reporting, companies often focus on areas they are already capable of measuring, such as direct effects from their own production (through CO₂ emissions) or direct Gross Value Added (GVA). However, the social, environmental, and economic impacts of corporate activities extend far beyond direct effects. As an example, indirect effects arise through purchased intermediate goods from suppliers while induced effects are generated directly and indirectly as a result of wages paid – together, these form what is known as spillover effects.
WISIT, the WifOR Sustainability Impact Tool, enables companies to independently calculate social, environmental, and economic spillover effects and identify hotspots across their global supply chains. Furthermore, WISIT supports companies with their Scope 3 emissions calculations as well as it provides a solution for the German Supply Chain Act (LkSG) reporting requirements.
Key benefits and uses:
- Calculate social, environmental, and economic impacts along organizations’ global supply chains, including Scope 3 emissions calculations in line with the latest standards.
- Identify hotspots in the supply chain and empower organizations to address them.
- Enable organizations to present their upstream social, environmental, and economic impacts for reporting, including a tailored solution for reporting requirements of the German Supply Chain Act (LkSG).
How does WISIT work?

Mit dem Laden des Videos akzeptieren Sie die Datenschutzerklärung von YouTube.
Mehr erfahren
Mit dem Laden des Videos akzeptieren Sie die Datenschutzerklärung von YouTube.
Mehr erfahren
Mit dem Laden des Videos akzeptieren Sie die Datenschutzerklärung von YouTube.
Mehr erfahren
Mit dem Laden des Videos akzeptieren Sie die Datenschutzerklärung von YouTube.
Mehr erfahren
Mit dem Laden des Videos akzeptieren Sie die Datenschutzerklärung von YouTube.
Mehr erfahren
Use Case: Impact Analysis with WISIT
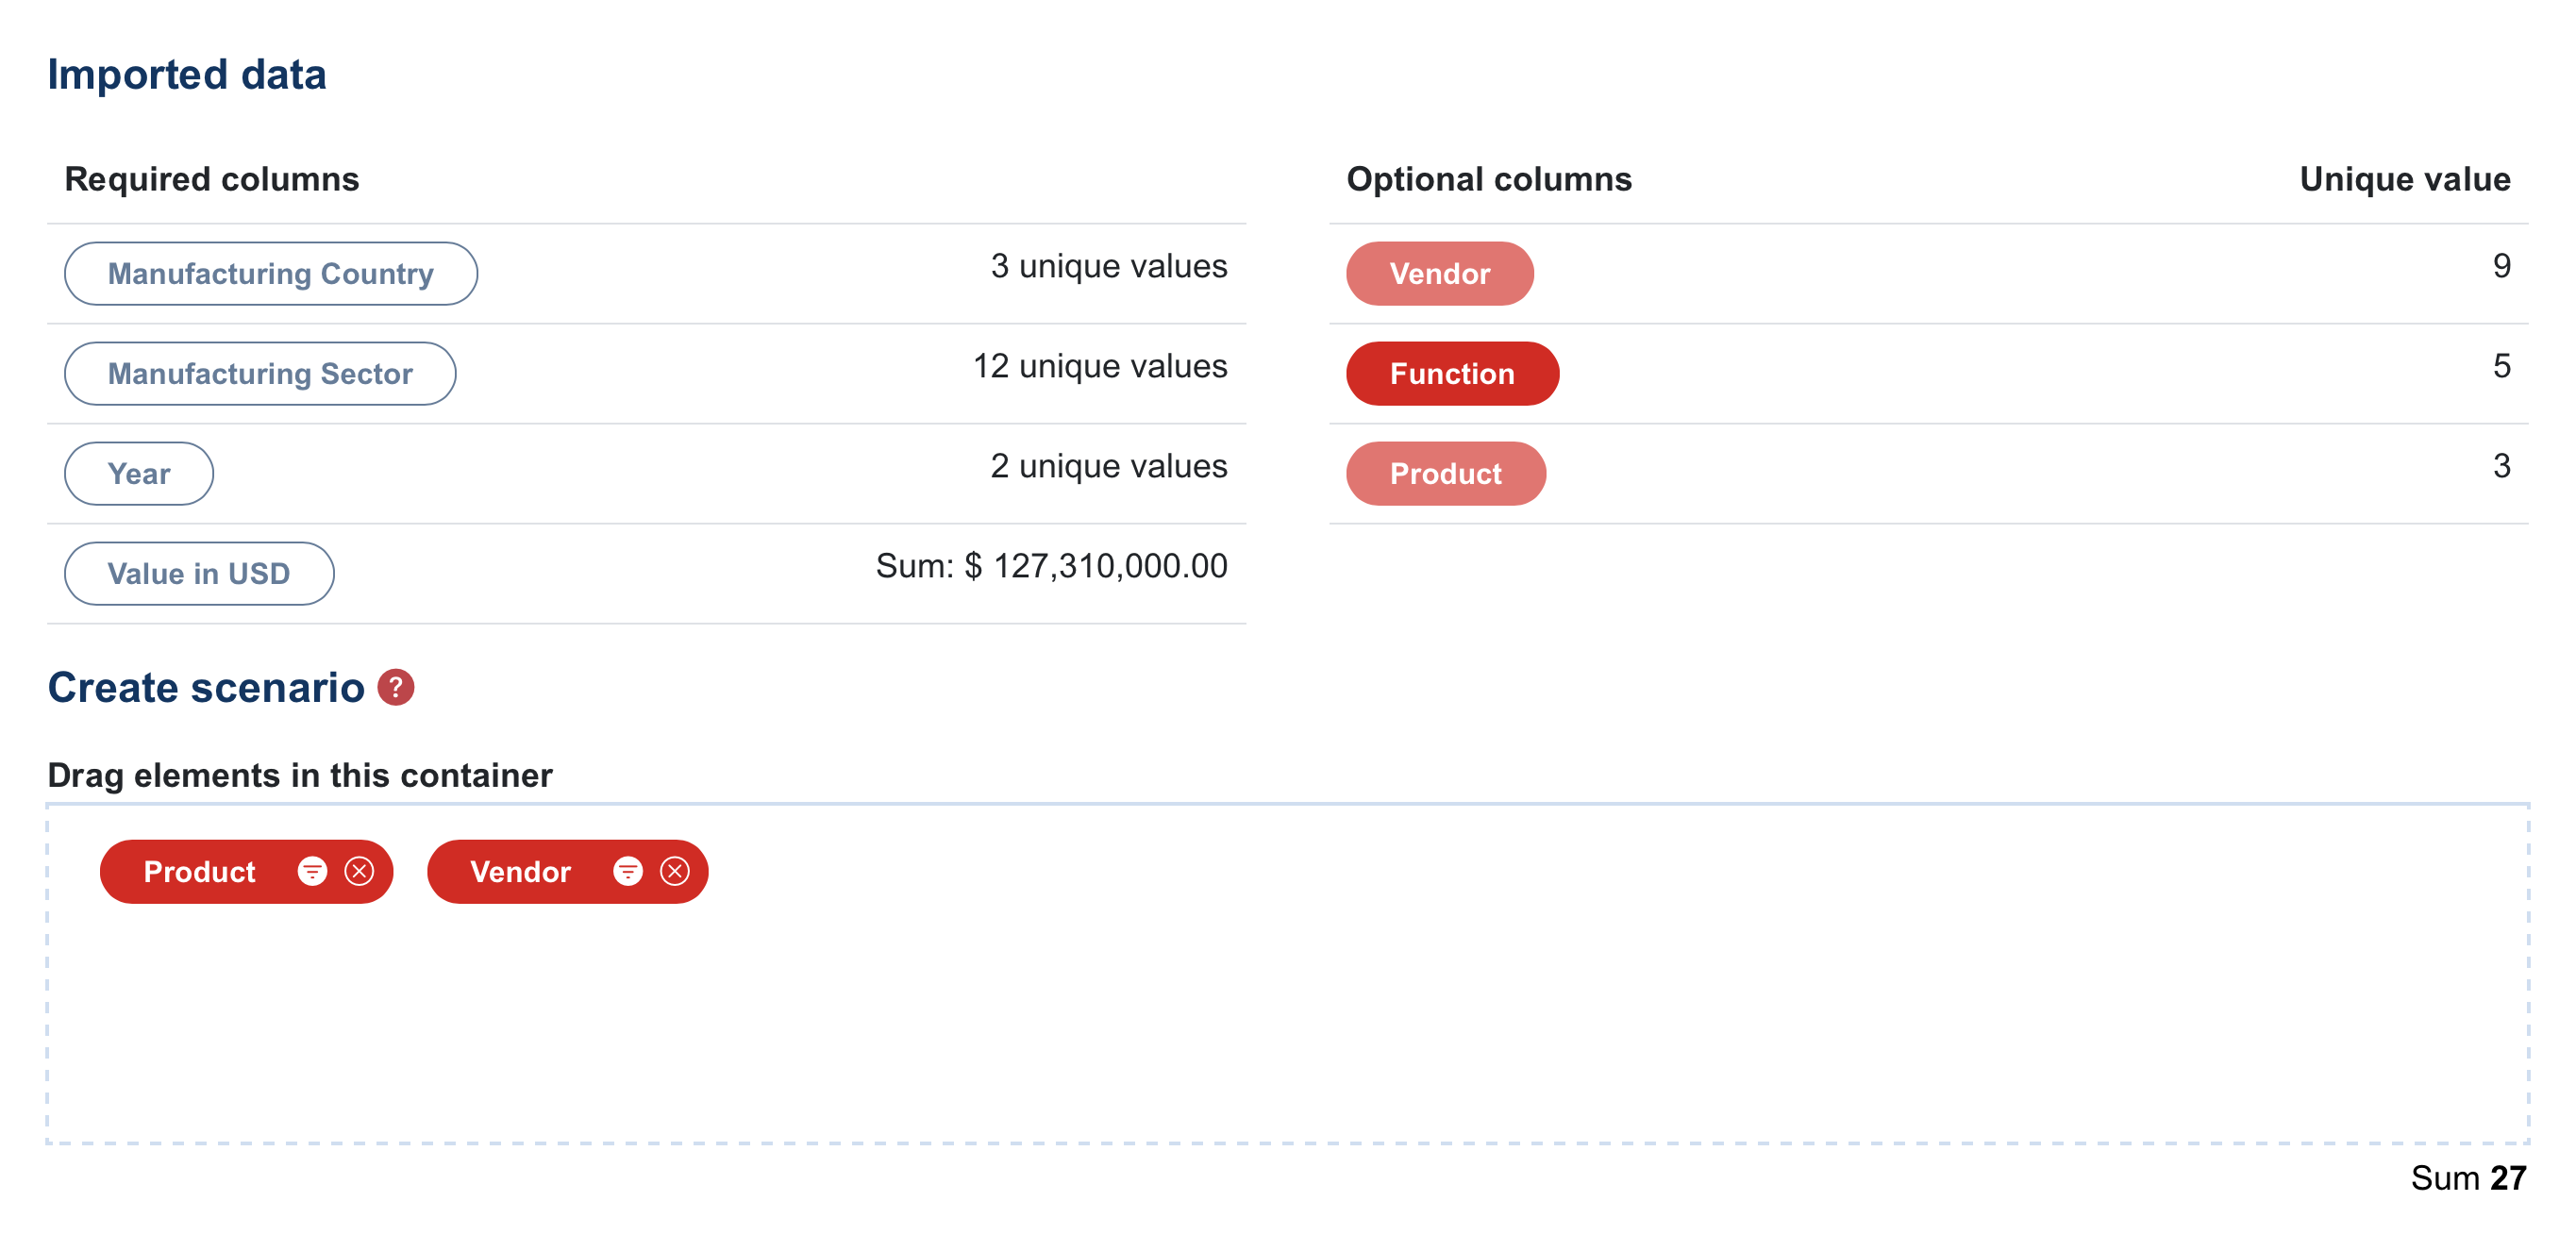
With WISIT, the WifOR Sustainability Impact Tool, organizations can independently calculate effects along their global supply chains based on their procurement data, also known as spend. In a first step, the purchasing data is prepared in such a way that it can be optimally used with the tool. After the import, the data can be broken down in different ways. One option is disaggregation, which displays the procurement data according to different individual categories specified in the spend. This means that if, for example, there is a column in the data that shows which product is responsible for which expenditure, WISIT can show the effects broken down by product in the results.
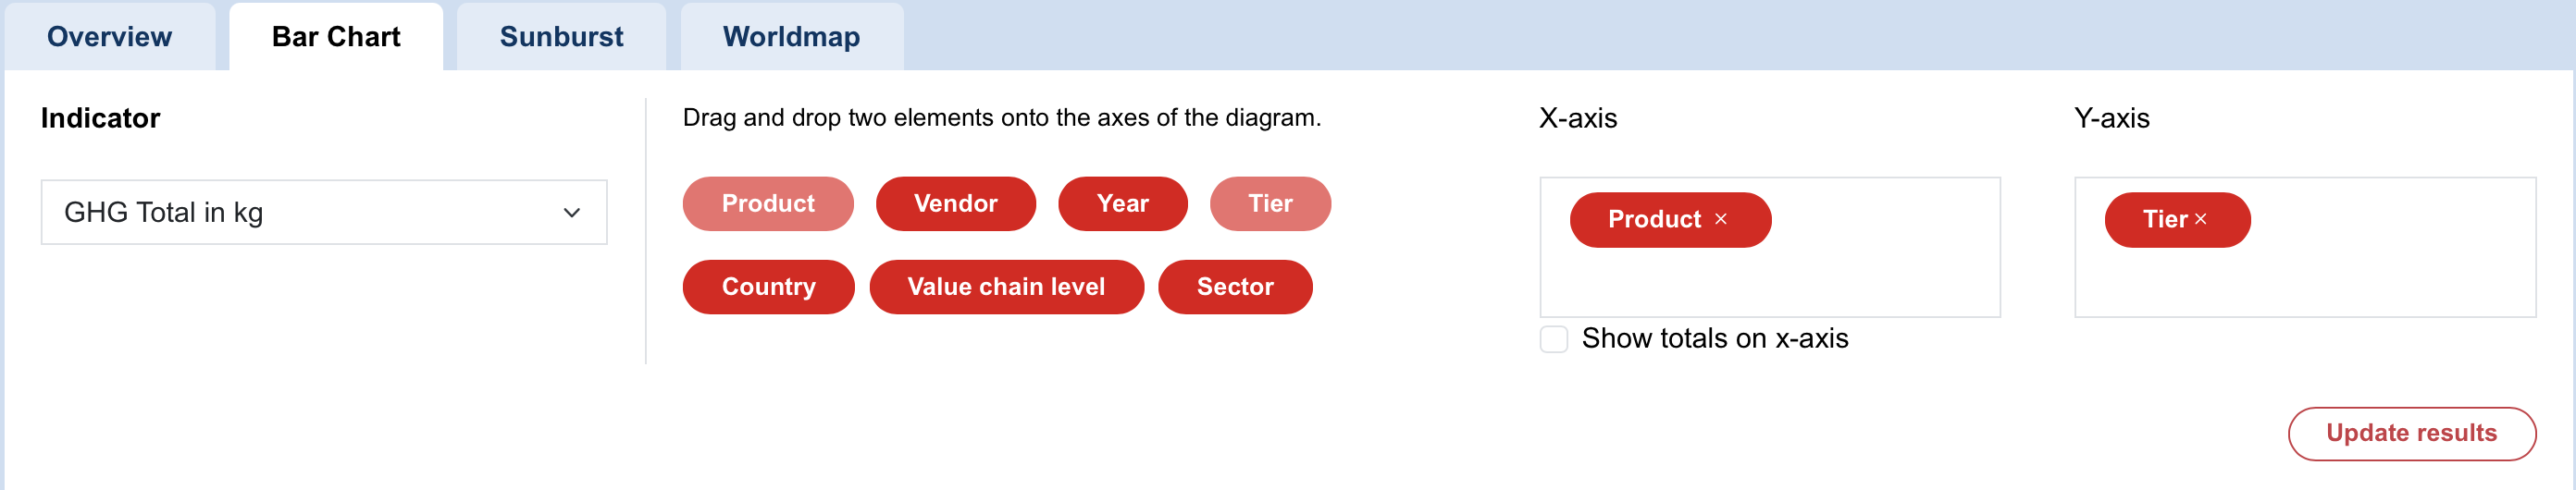
The spend below is an example. It is subdivided into units including “Vendor”, “Product”, and “Function” – these are the possible “Scenarios”. The desired scenarios can be dragged and dropped into the box below, such as “Vendor” and “Product”. This calculates the impacts triggered, disaggregated by vendor and product.
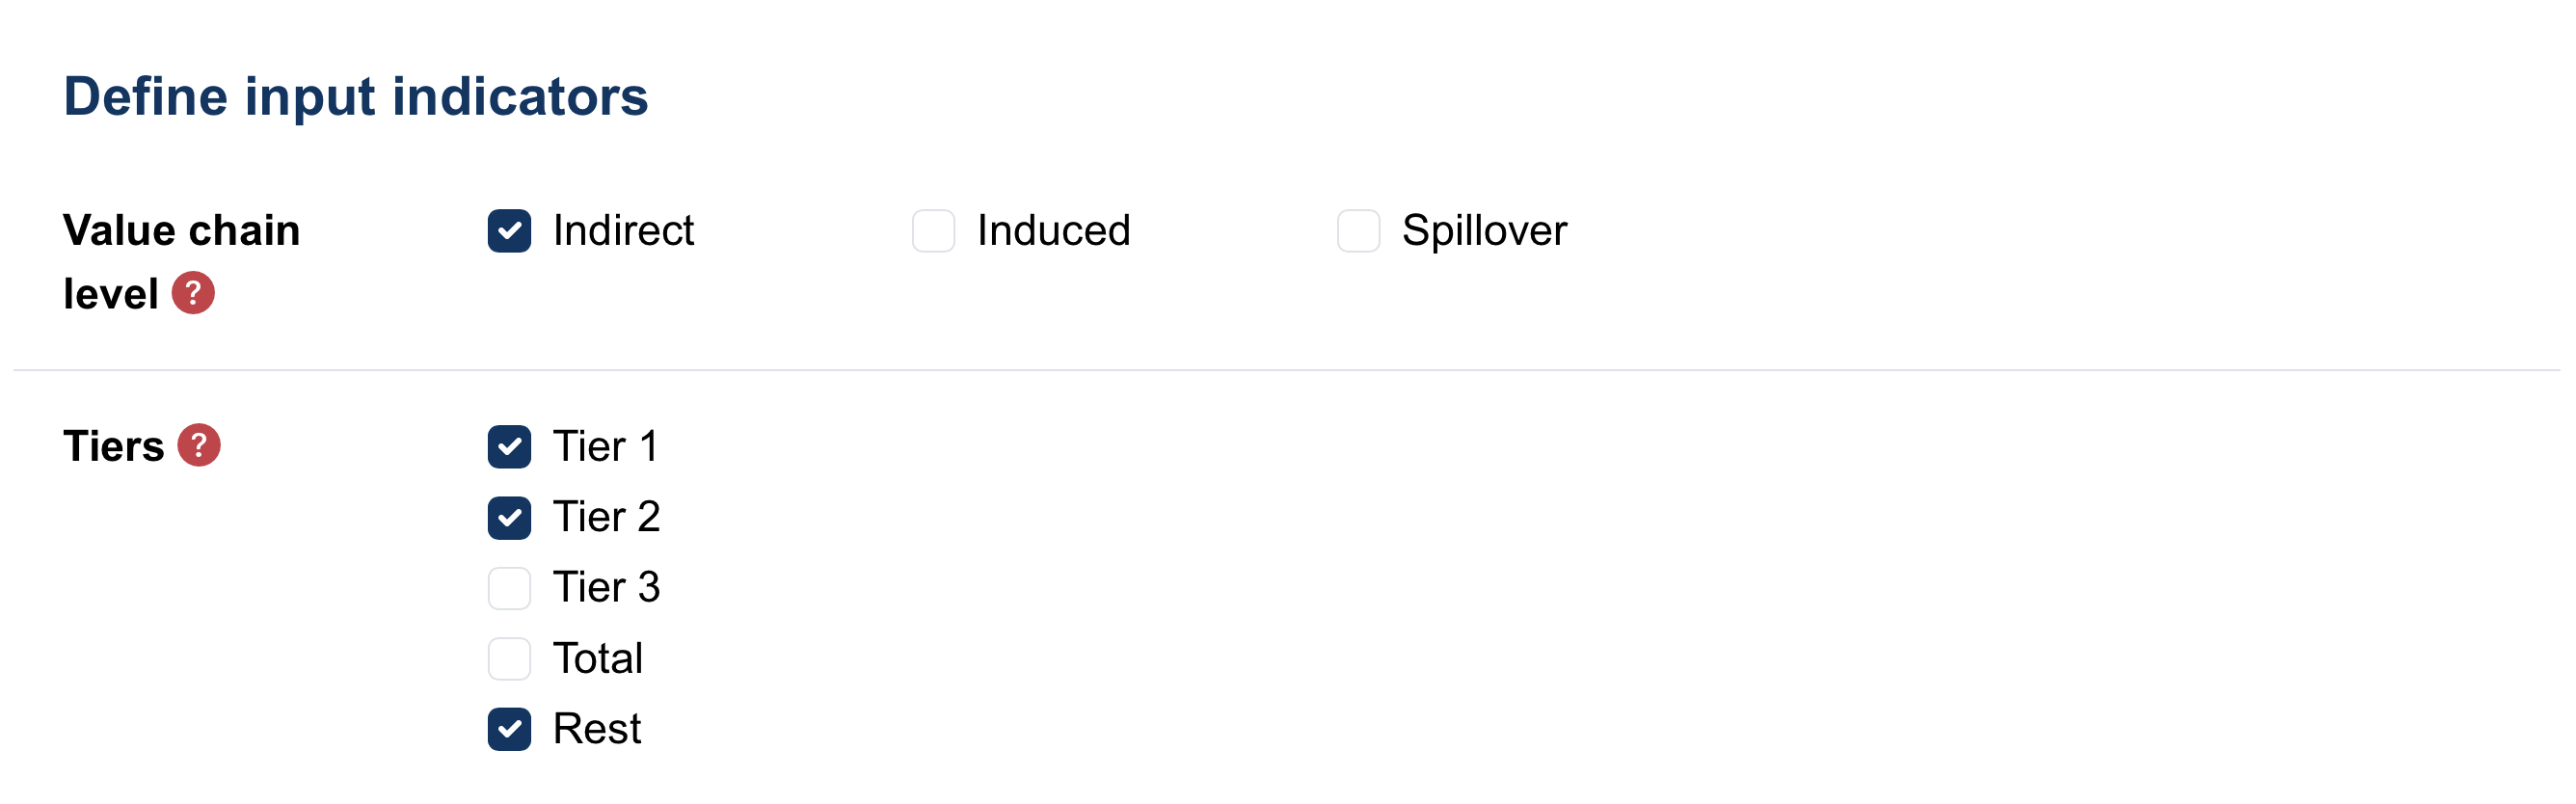
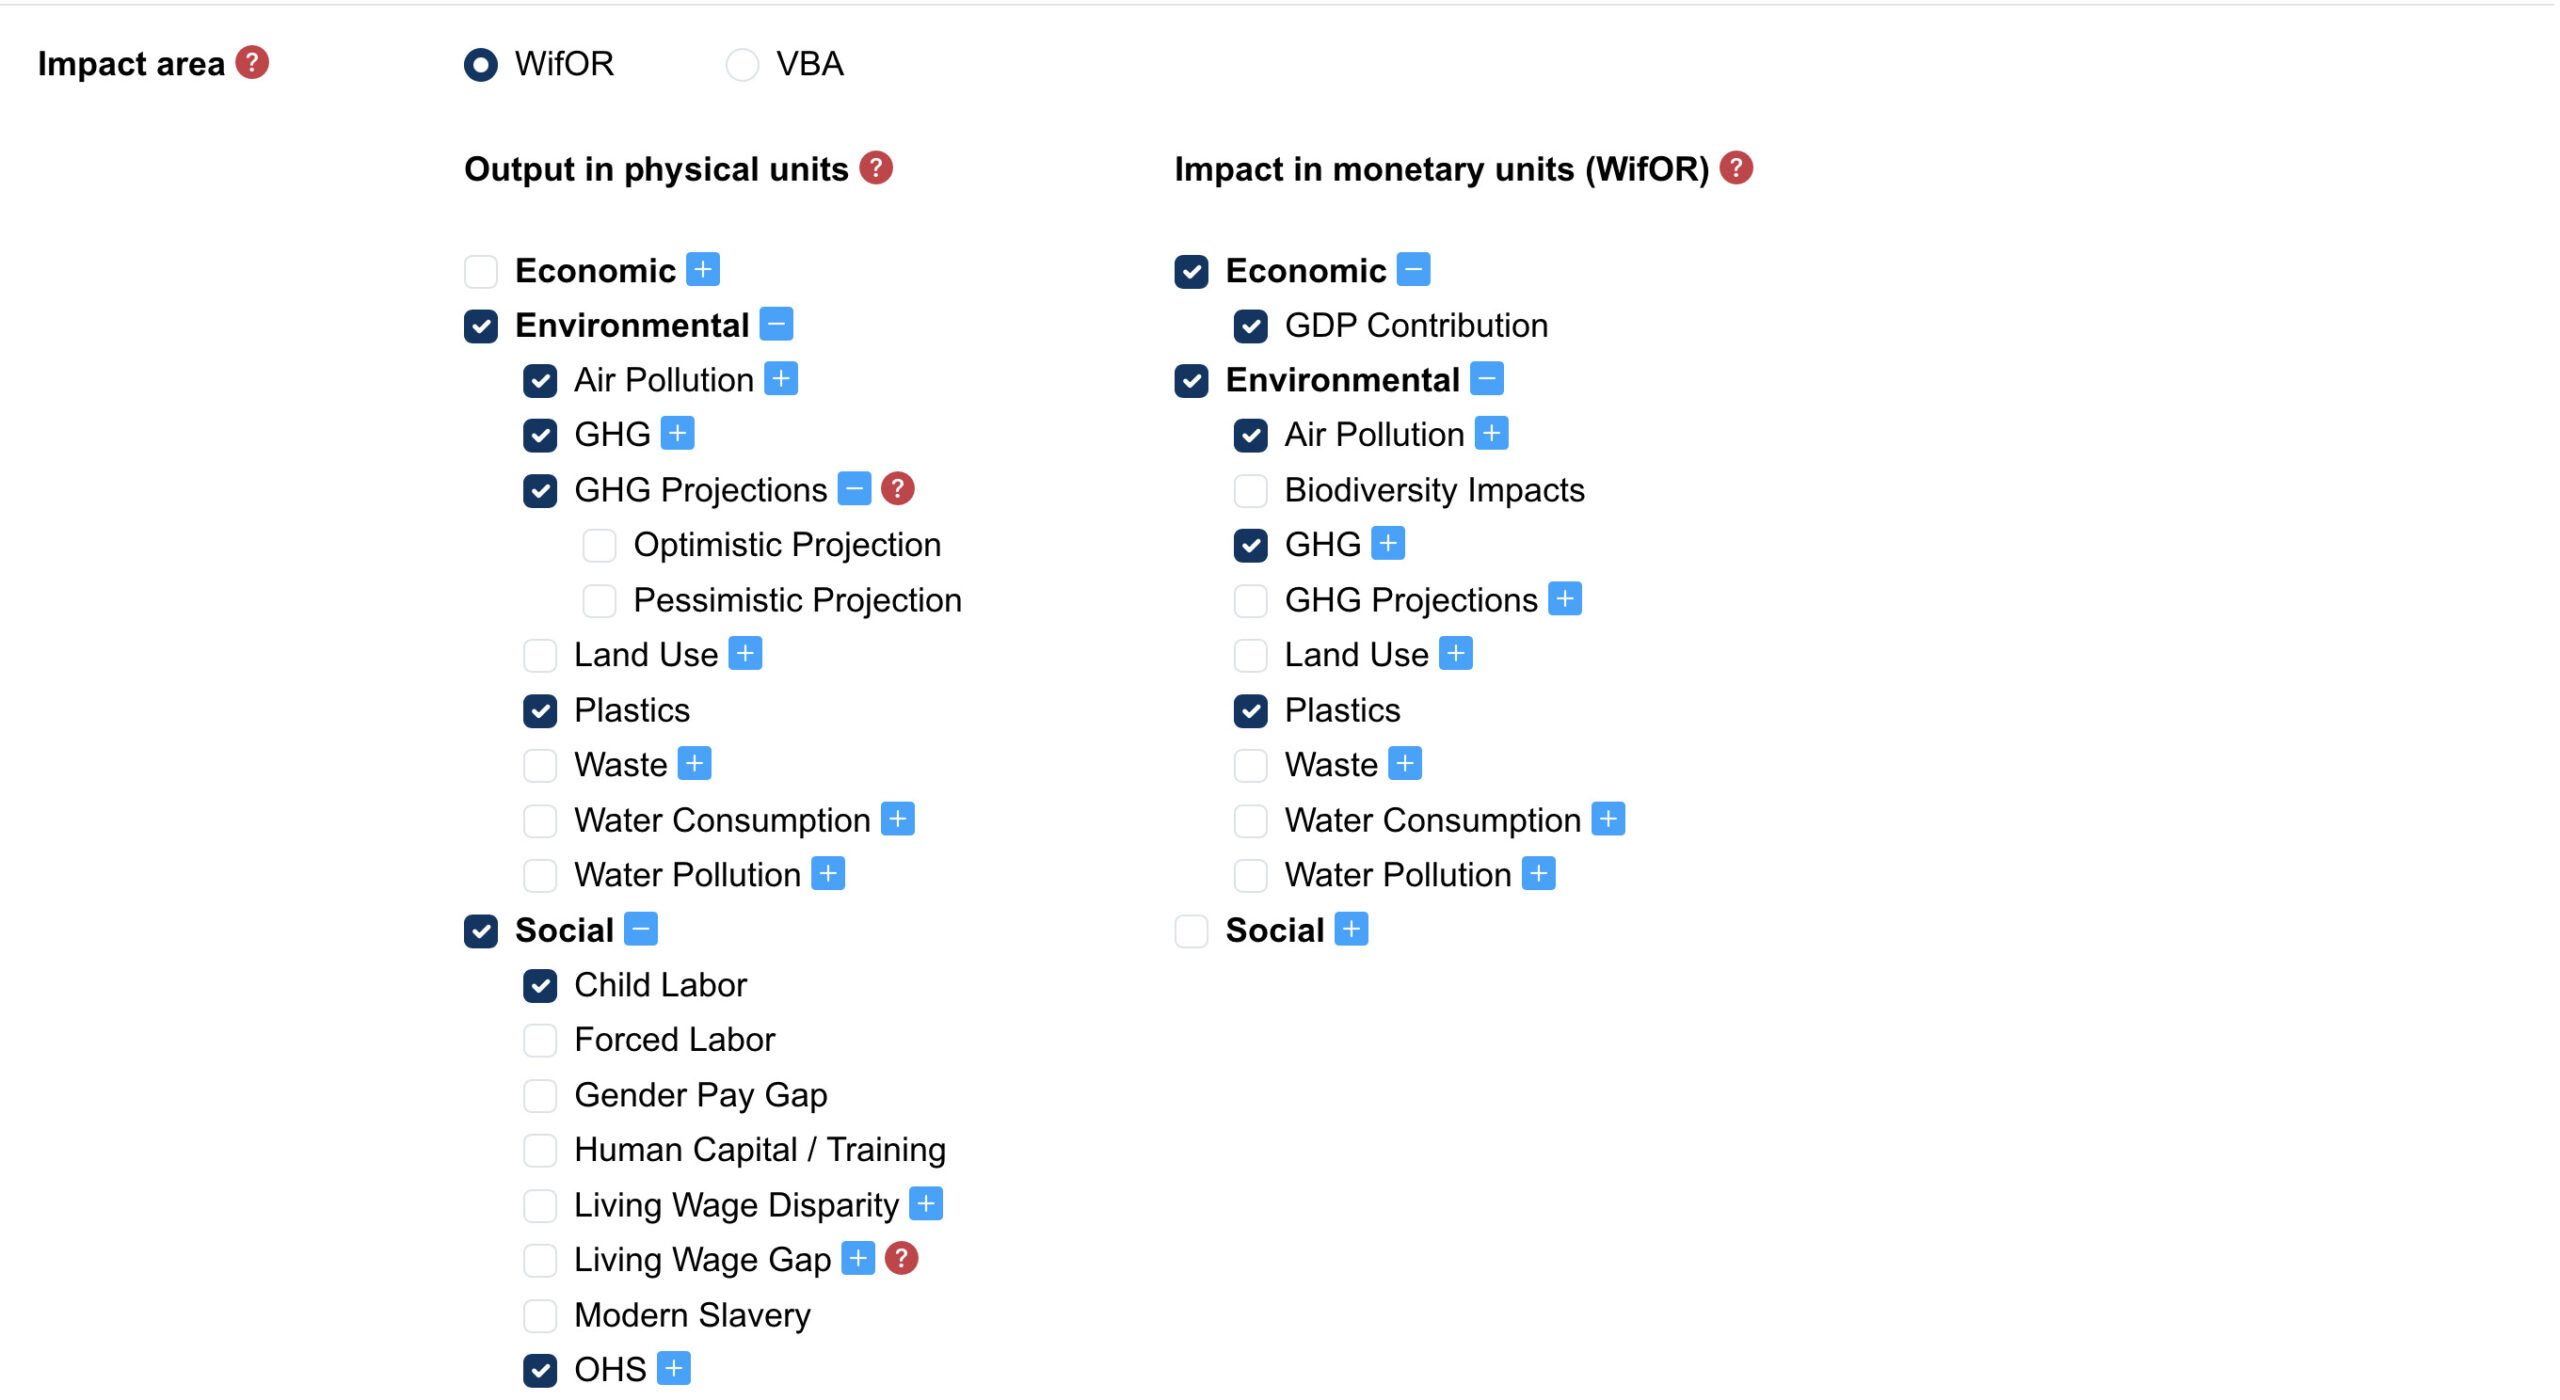
In addition, it is also possible to select whether the tool should calculate indirect, induced, or both as spillover effects. The supply chain level can be freely chosen up to tier 3. For sustainability indicators, a company can choose from social, environmental, and economic indicators and select between physical units (e.g., metric tons of CO₂) and monetary units (societal impacts measured in USD of emitted CO₂).
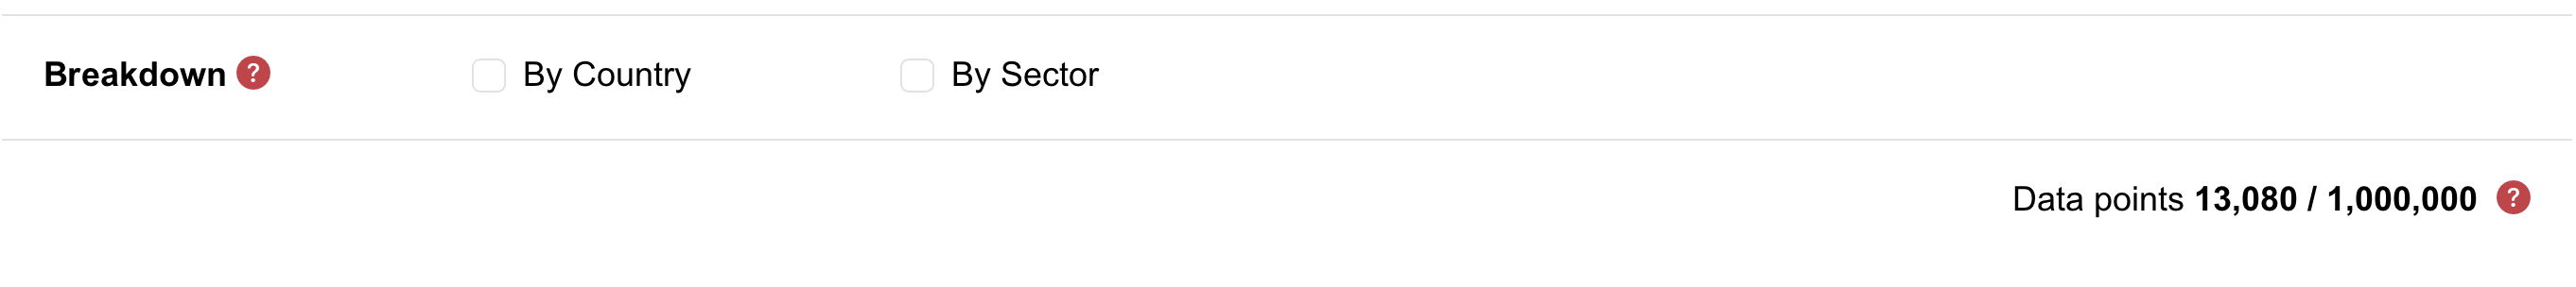
For monetization, users can use WifOR’s coefficients or those of the Value Balancing Alliance (VBA). These are the determined conversion values, which are used to evaluate the societal significance of physical units and convert them into monetary values. In the last step, users can filter the results by country or sector.
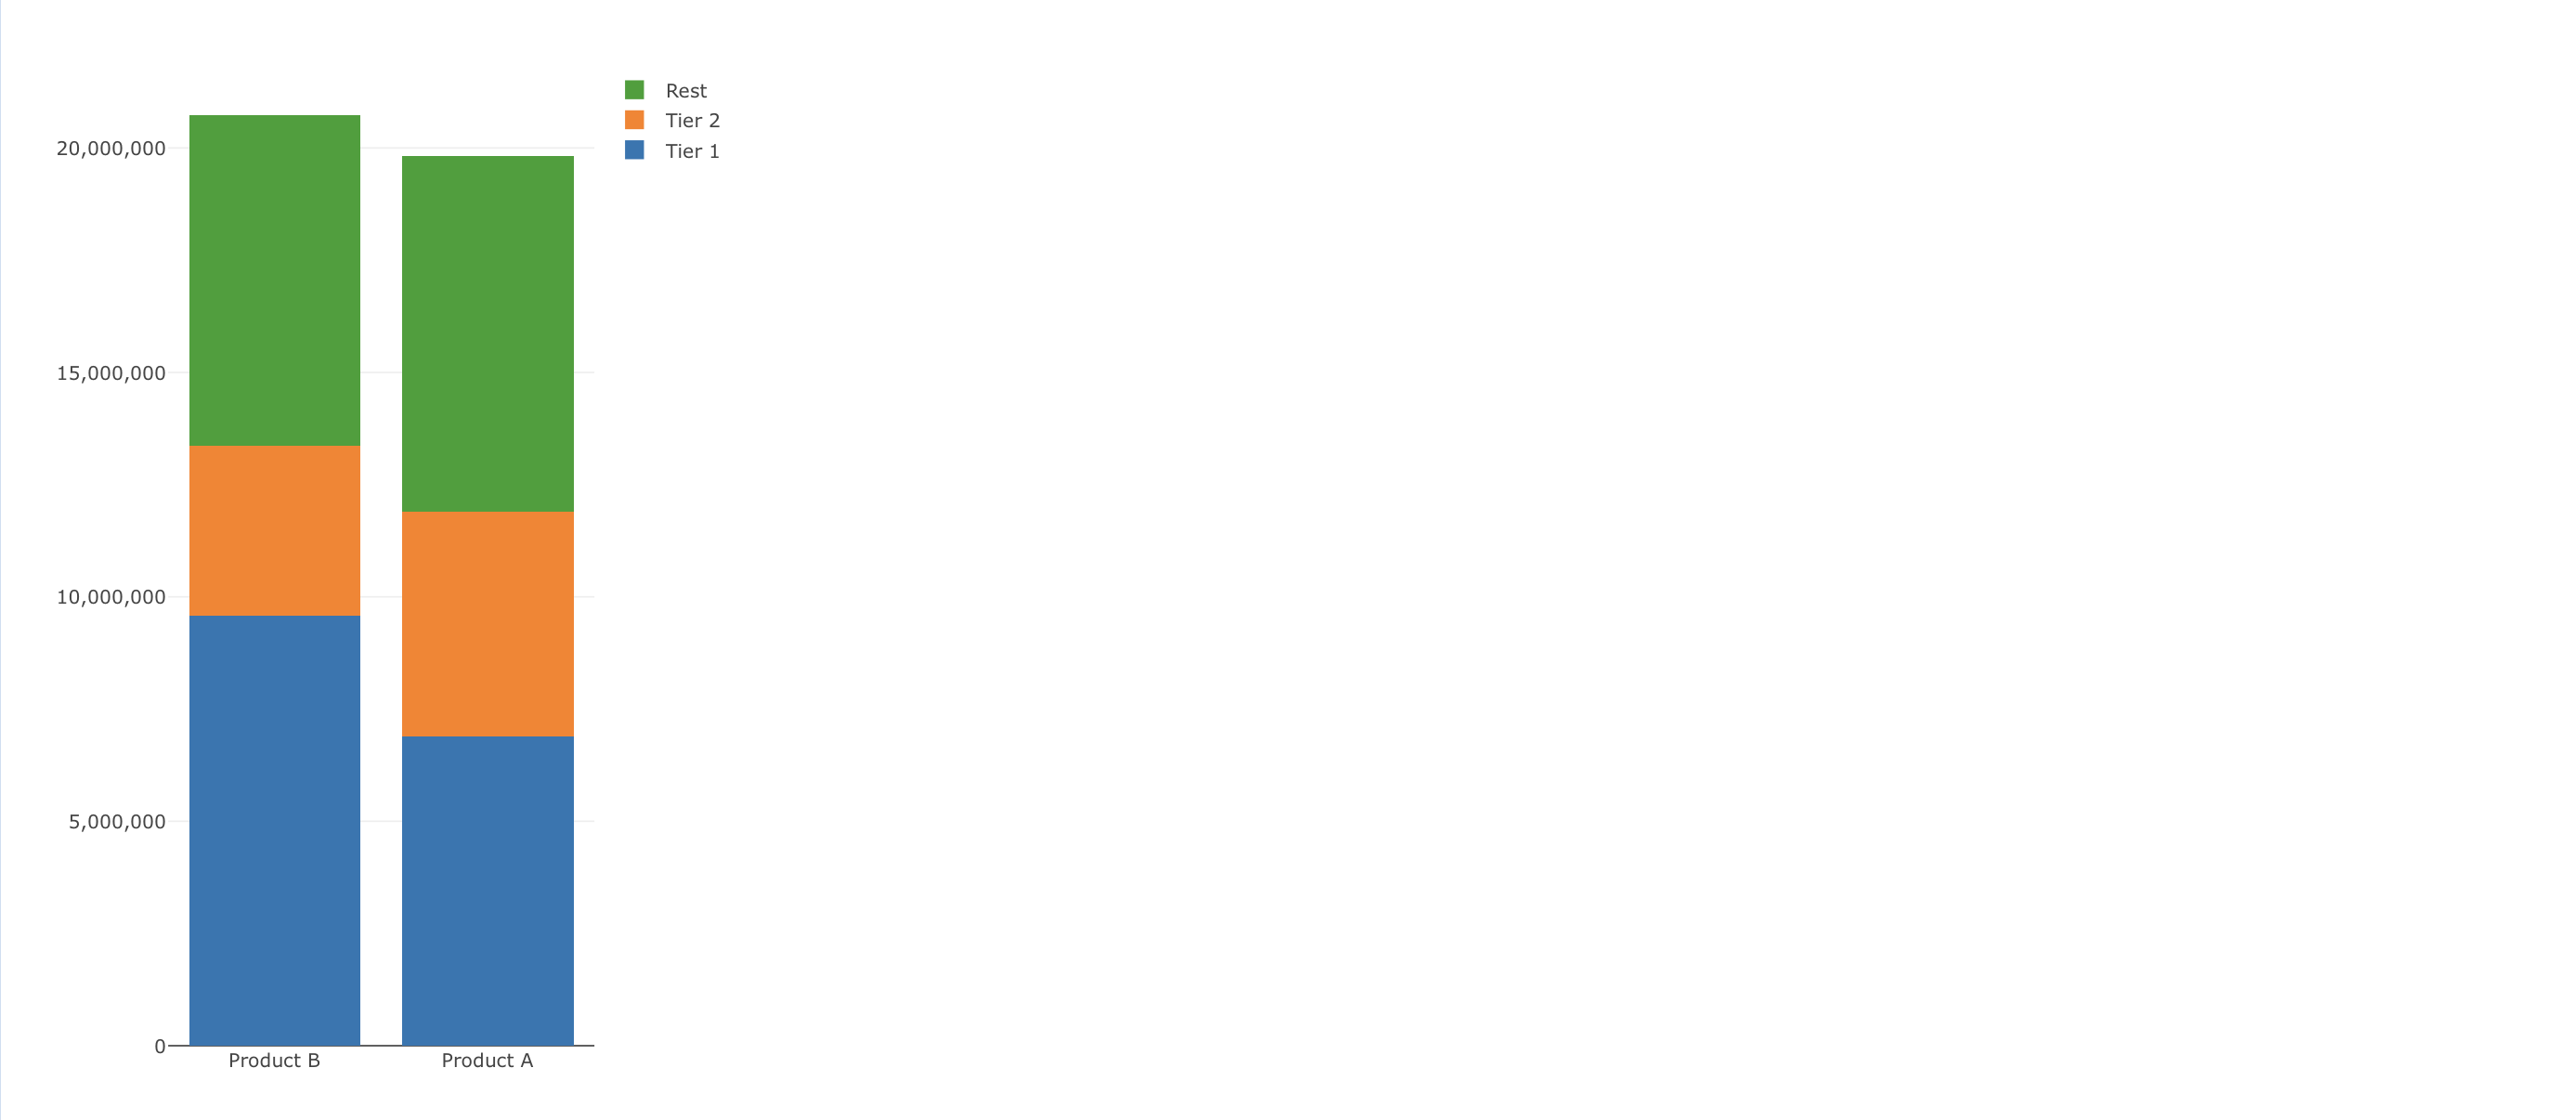
There are various options for presenting the results. The bar chart creates a diagram for an indicator selected from a dropdown menu on the left. The available options can be placed on the x- and y-axis by drag and drop. In the example, the graph shows that most greenhouse gas emissions are generated by Product B in Tier 1. As a result, the company has found a hotspot. The results can be downloaded as an Excel list if requested.
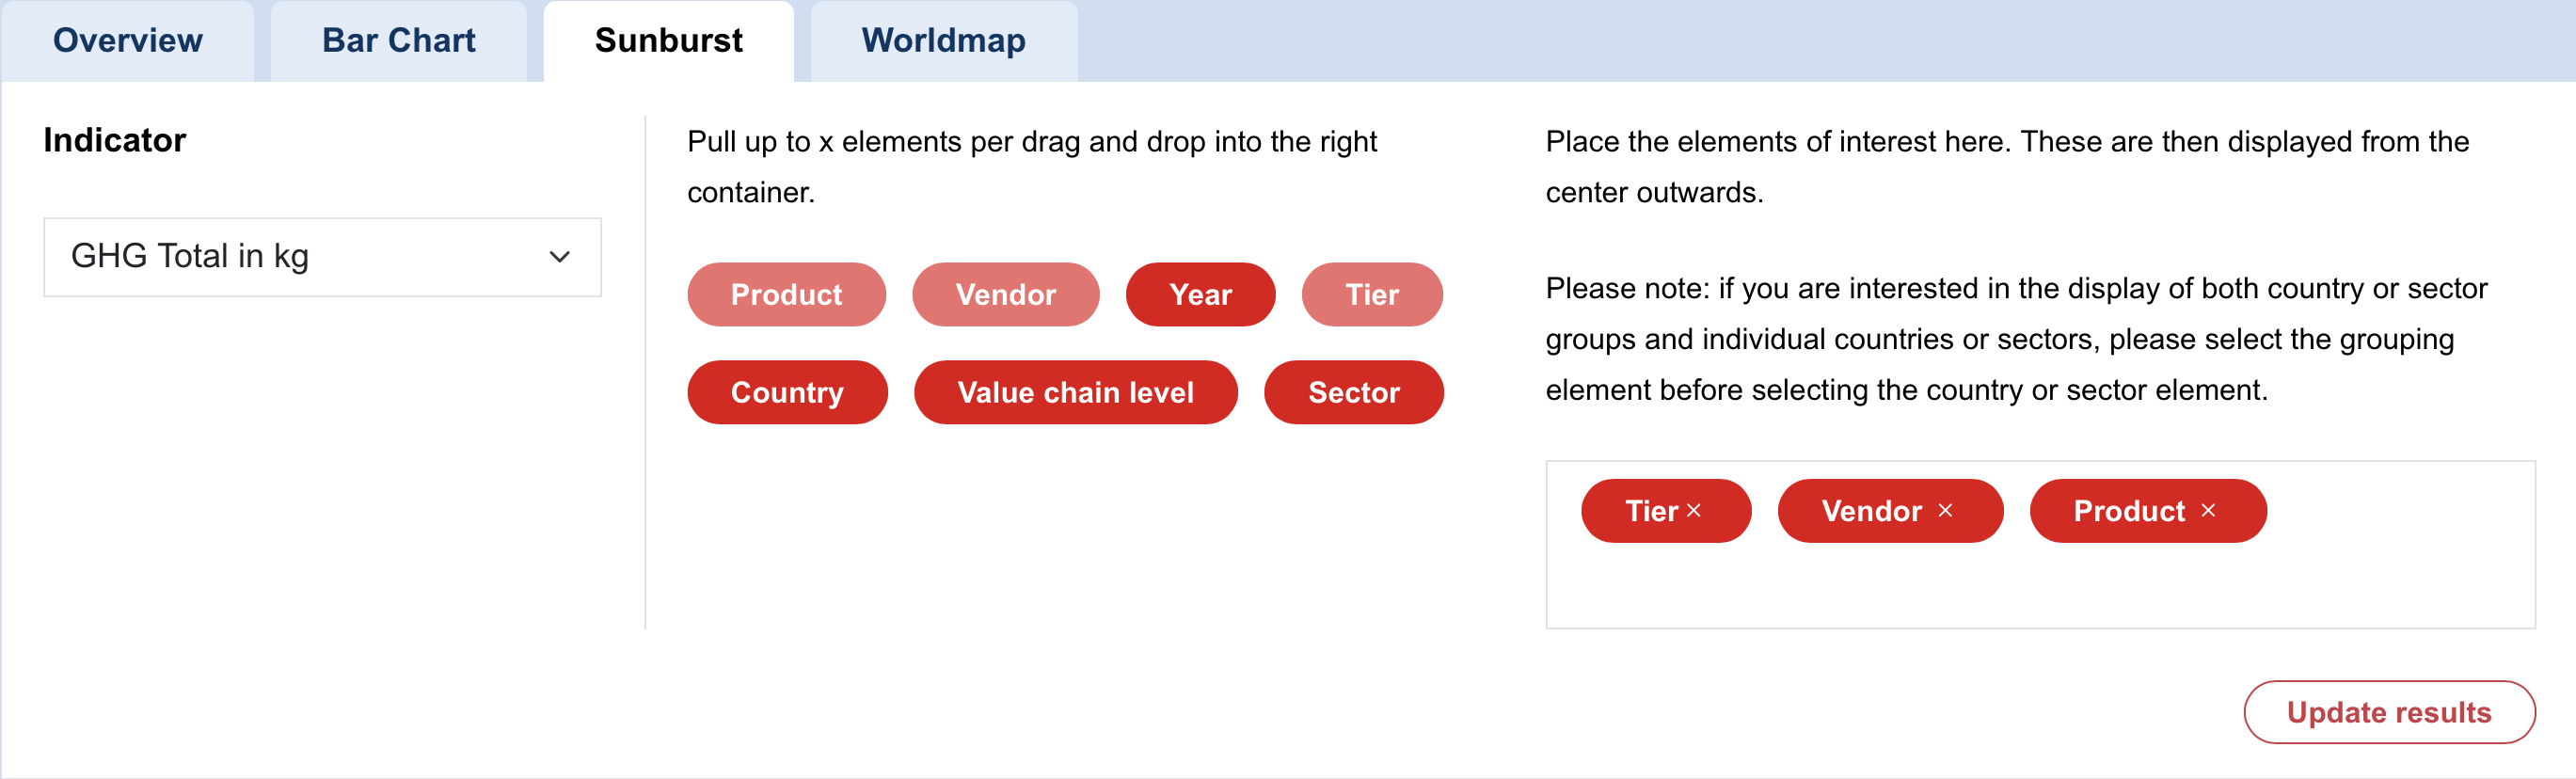
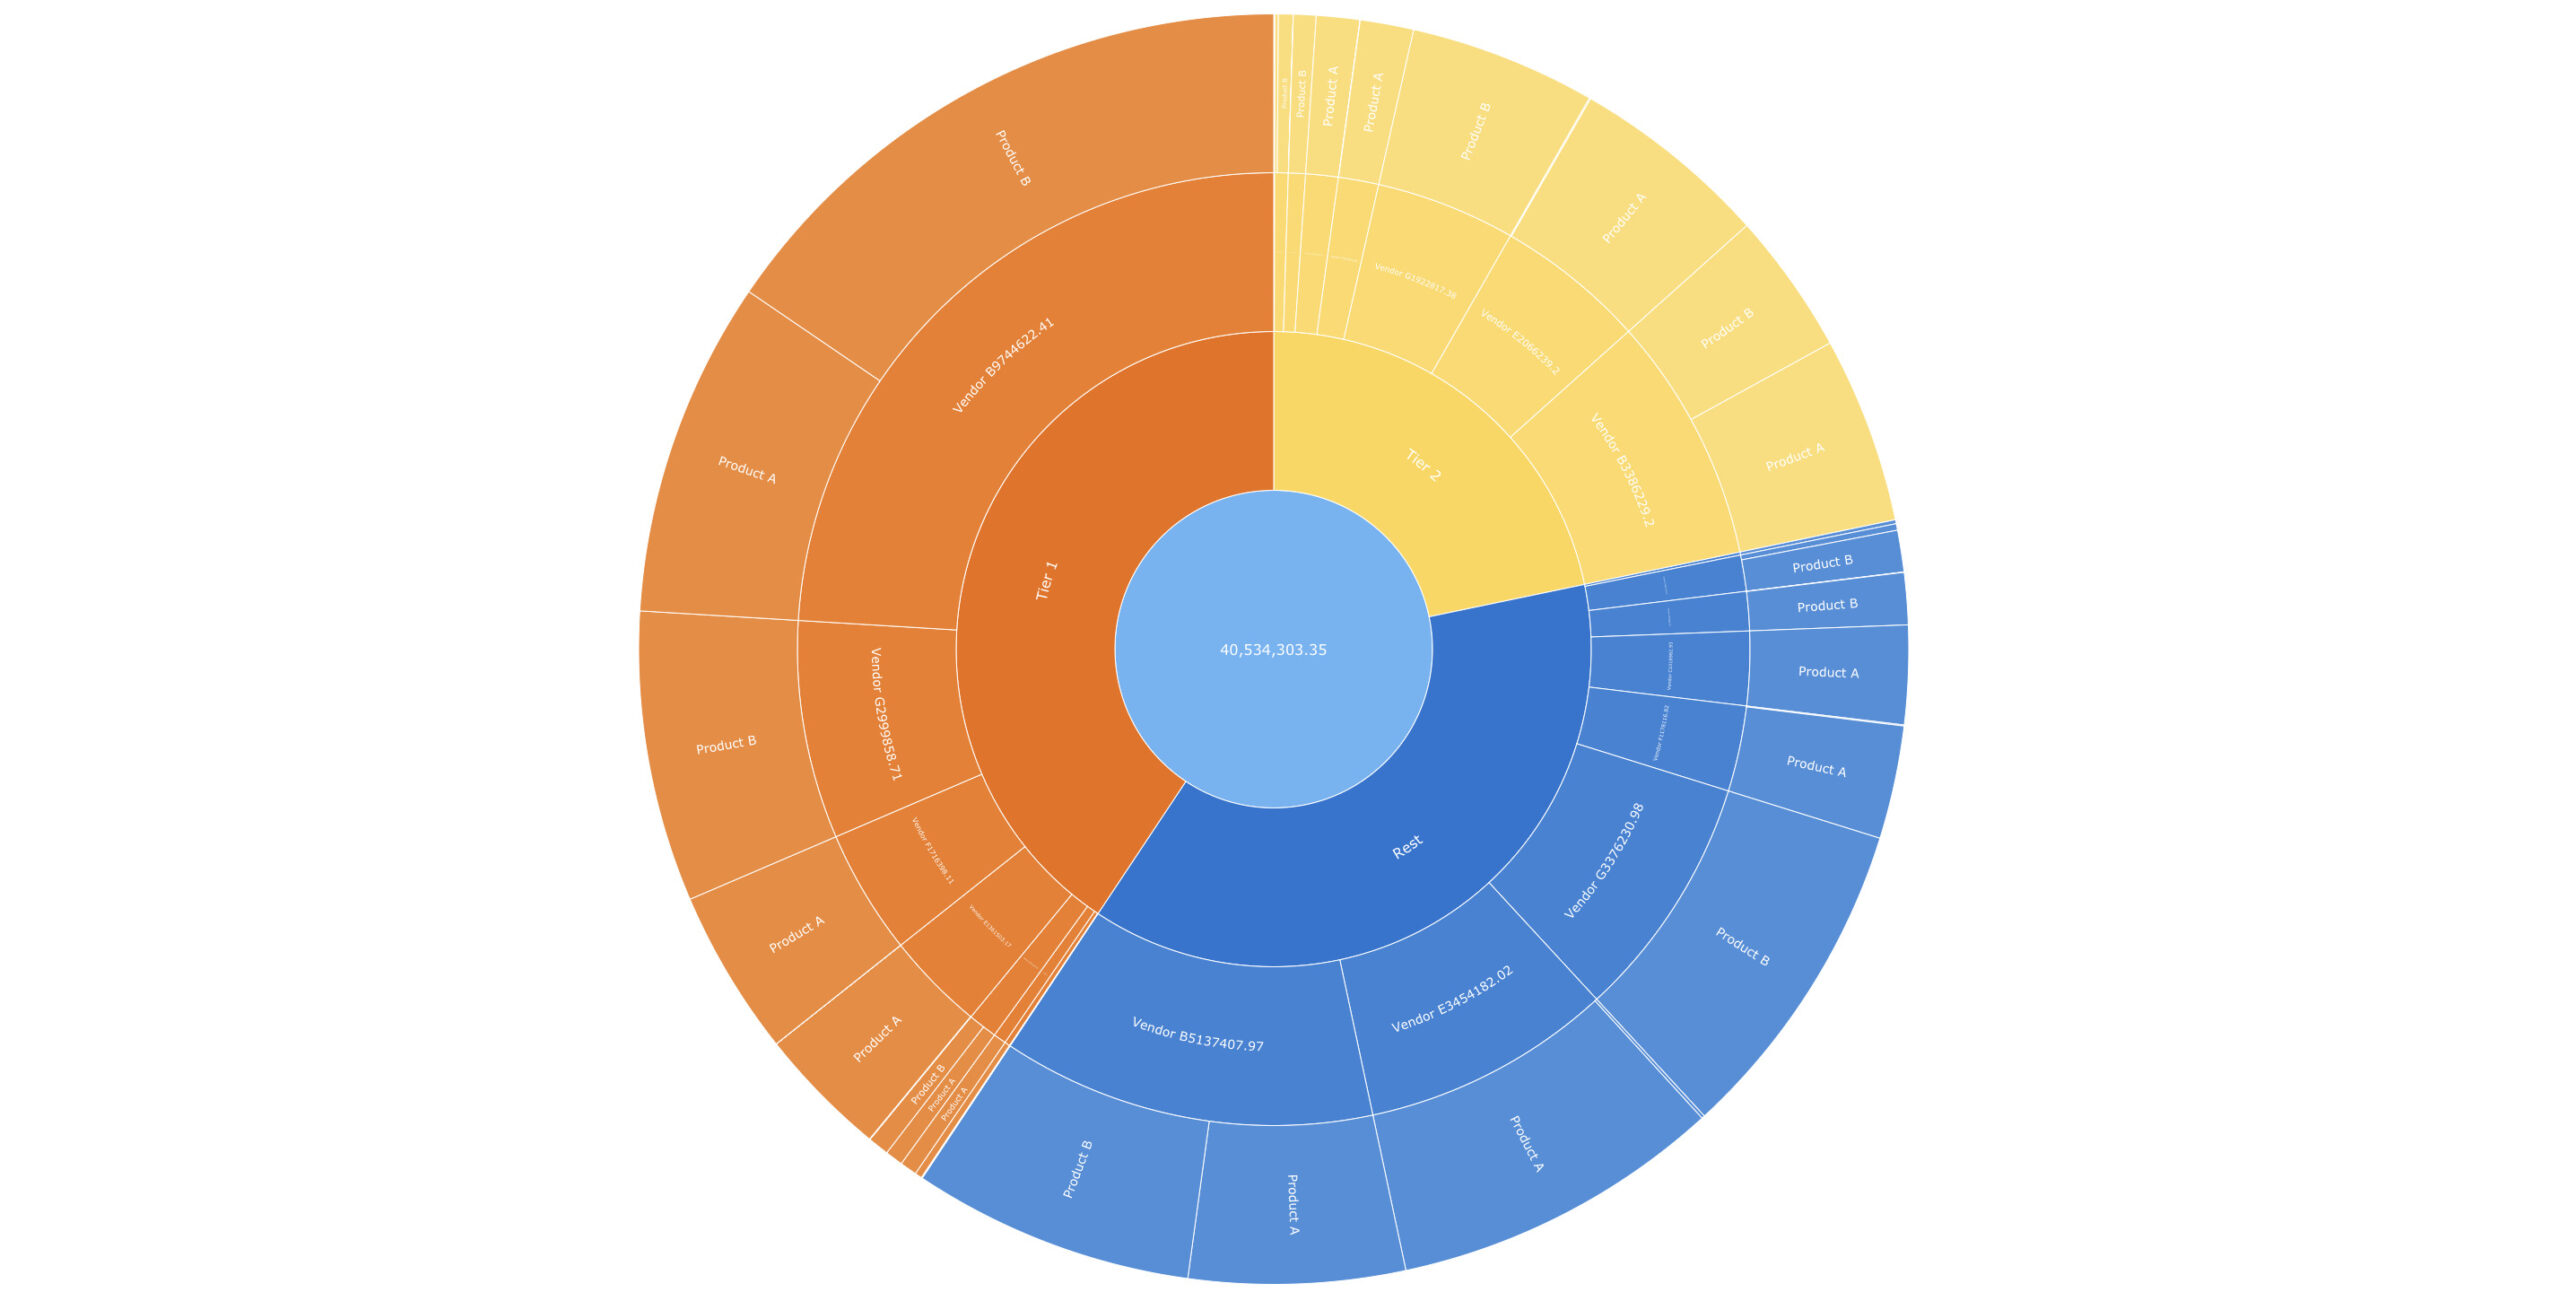
The sunburst diagram works in a similar way. An indicator is first selected from the dropdown menu and the elements can then be dragged and dropped into the box on the right. This visualizes the greenhouse gas emissions caused by the different by the different products by their respective vendors in different tiers.
With the help of these analyses, organizations can make decisions based on the resulting social, environmental, and economic impact. WifOR has been supporting companies, ministries, associations, and industries for over a decade to develop targeted measures to improve their sustainability strategies. If you would like to learn more about our methodology, please get in touch with our experts.
Latest articles from WifOR’s Sustainability Research
-

Interview with Dr. Richard Scholz
Using Impact Valuation to act responsibly – along the supply chain
-

A comparison of German and European supply chain laws
New supply chain laws: What do they mean for companies?
-
Nonfinancial Reporting
Net Zero – What does it mean for companies?