

What is the Economic Footprint?
The Economic Footprint assesses the contribution of an organization to the national economy. It comprises the total economic effects – from both direct corporate activities and along the entire value chain. The assessment is based on a range of indicators: income, employment, labor productivity, research and development (R&D) activities, and R&D intensity.
The Economic Footprint as one pillar of the triple bottom line
John Elkington developed the “triple bottom line” in the 1990s. Instead of focusing purely on financial indicators, the triple bottom line takes three dimensions into account: social, environmental, and economic sustainability. The Economic Footprint is thus one pillar alongside the Social and Environmental Footprints.
Triple bottom line: The Social and Environmental Footprints
The Environmental Footprint measures the impact an organization has on the environment by capturing the effects of economic activities on natural resources. Indicators include land use, water use, air emissions, and natural resource consumption.
Alongside the Economic and Environmental Footprints, the Social Footprint looks at a company’s impact on society. It includes a variety of social indicators, such as workforce diversity, occupational accidents, work-related diseases, and the risk of child labor in the supply chain.
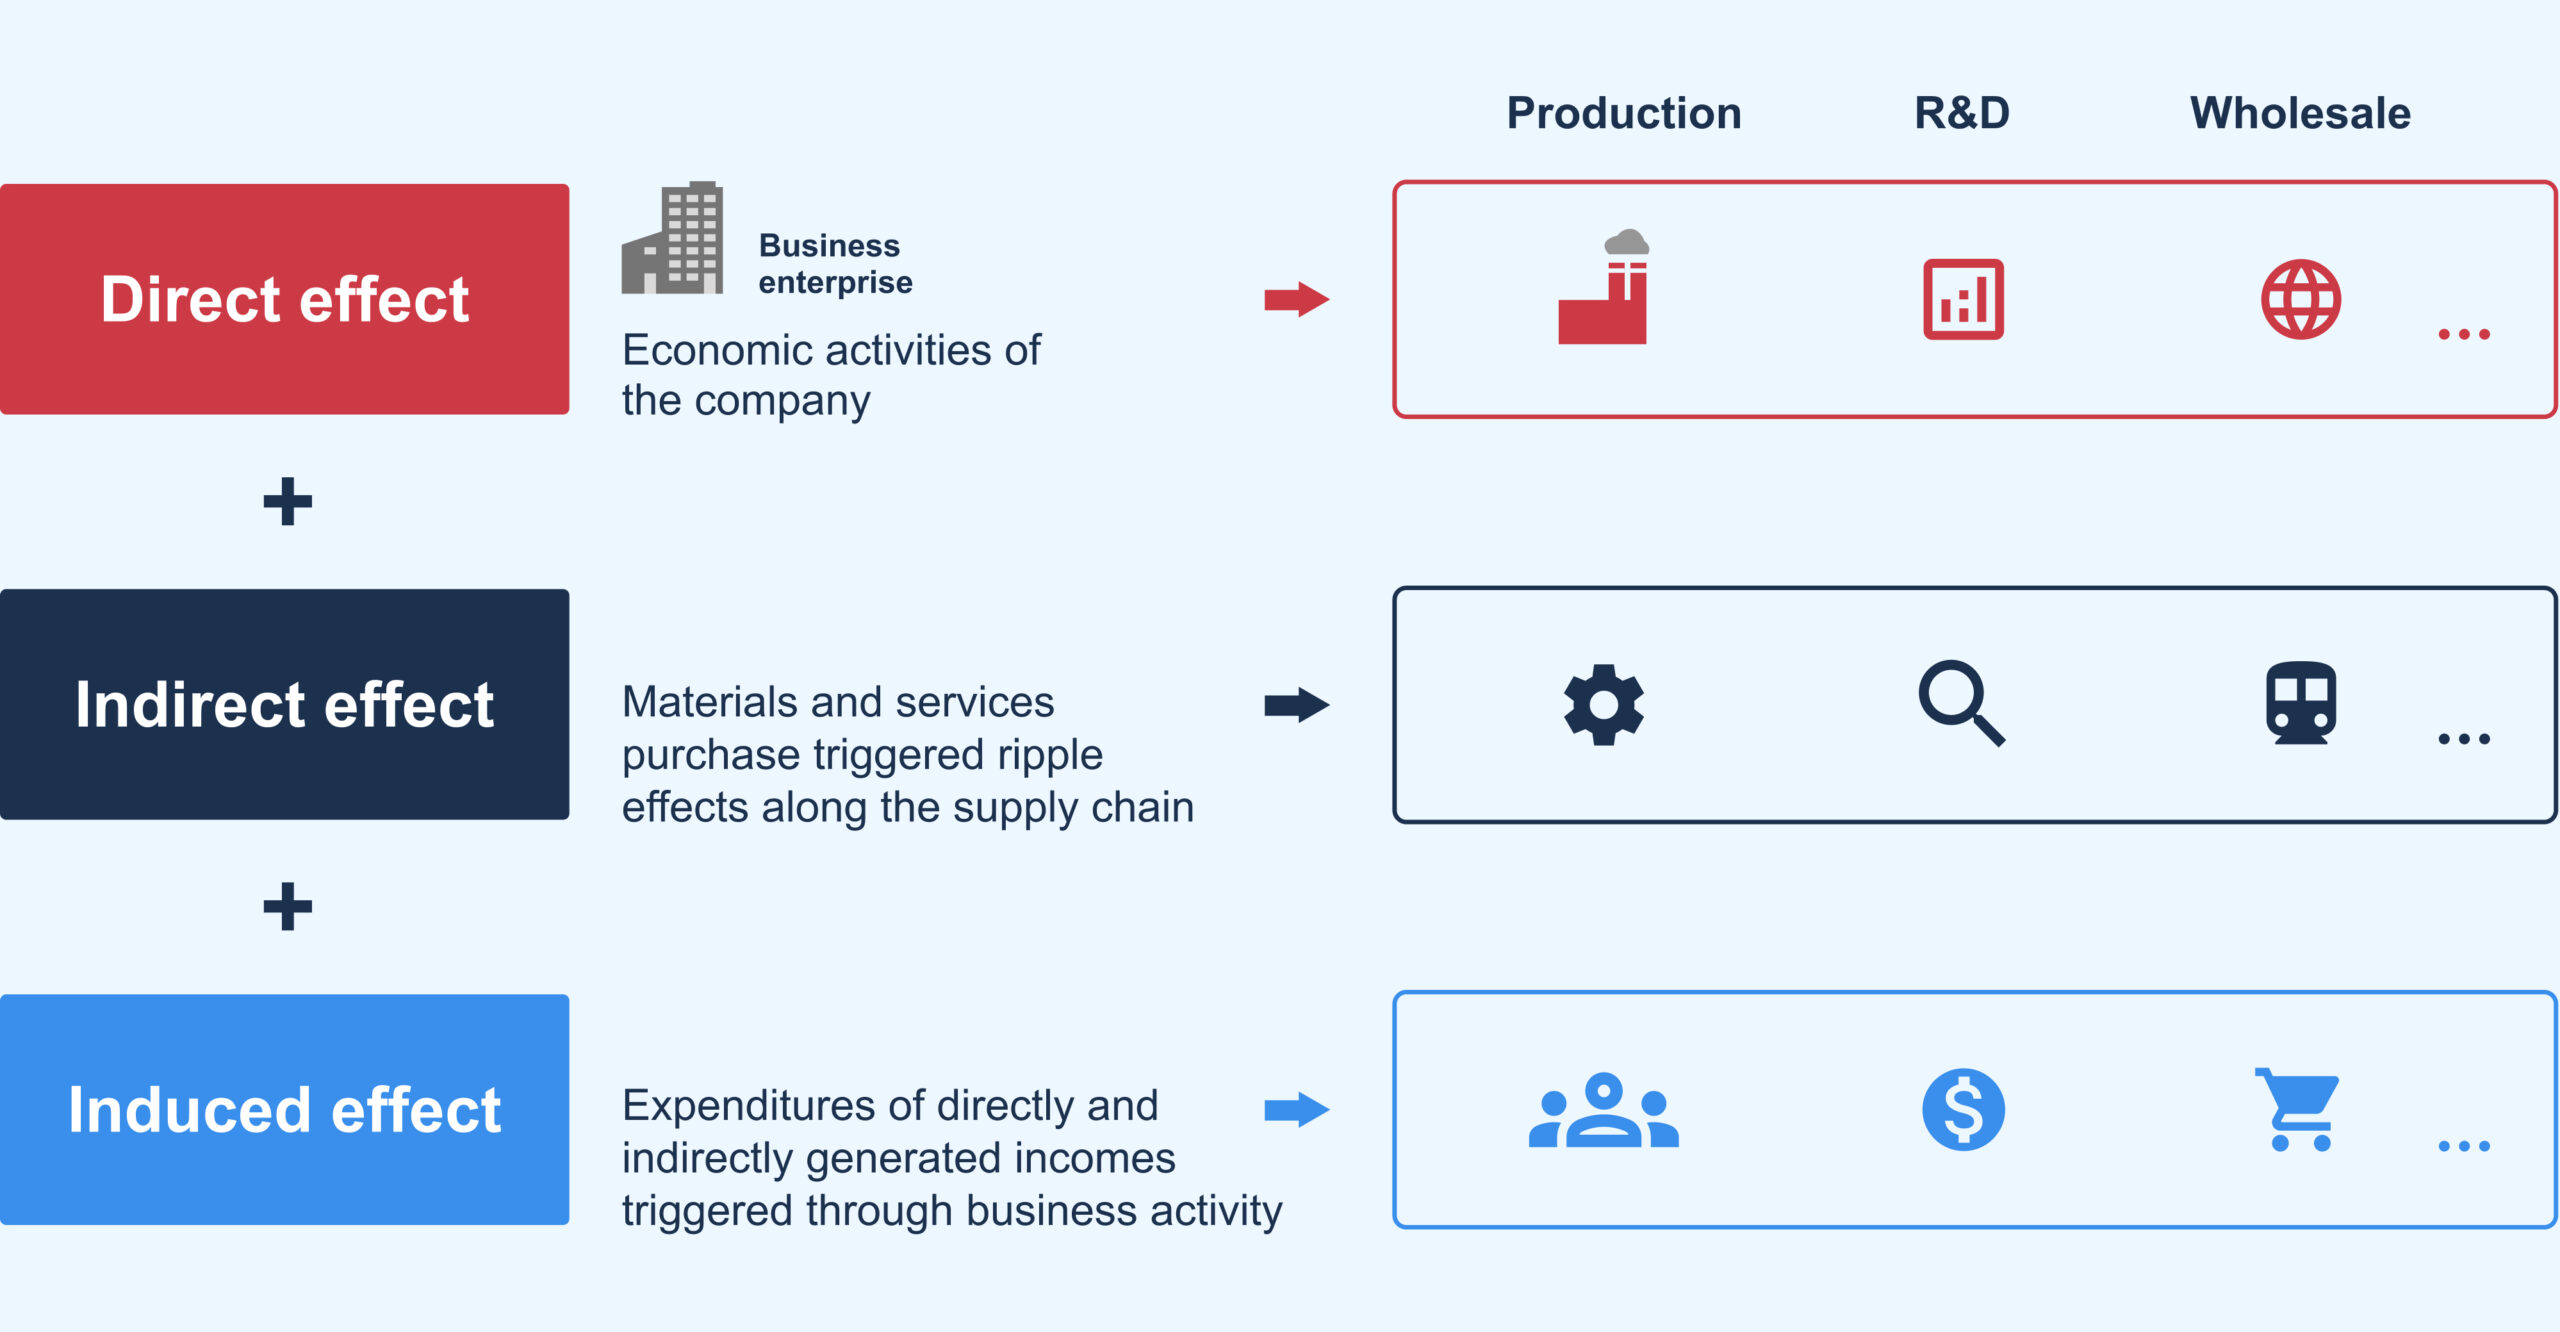
Calculating the Economic Footprint
The Economic Footprint incorporates the direct, indirect, and induced economic impacts of a company. Direct effects result, for example, from salaries paid or taxes. Indirect effects arise from the purchase of goods and services by the company, while induced effects capture the economic impact from salaries paid – both directly and indirectly.
Indicators
Economic indicators are metrics for an organization’s impact and enable a multidimensional assessment of an organization’s Economic Footprint. The three most commonly used indicators, gross value added, employment and research and development, are explained in more detail below.
Gross Value Added (GVA)
The widely accepted method for measuring a company’s direct economic impact is its contribution to gross domestic product (GDP). GDP is both a proven indicator of the market value of goods and services produced and a more comprehensive measure of contribution than profits alone. The technical term for the GDP contribution of a company is gross value added (GVA). GDP is a measure of gross value added of all economic actors in a country, plus taxes and minus subsidies. Therefore, the GVA of a company can also be referred to as the GDP contribution.
The system of national accounts defines GVA as the value of output minus the value of intermediate consumption. Output refers to the total of products created during the accounting period (Eurostat 2013). Intermediate consumption consists of goods and services consumed as inputs in a production process, with the exception of fixed capital goods. This is recorded as consumption of fixed capital. The goods and services are either transformed or consumed by the production process (Eurostat 2013).

Employment
Employment reflects the number of jobs supported by an organization’s economic activities. Direct employment effects are the total number of people employed. Indirect jobs are those created by the purchase of inputs along the supply chain, while induced jobs are those supported by the spending of the organization’s employees.
Research and Development
Research and Development (R&D) enables new combinations of existing resources and is considered the origin of knowledge-based, long-term economic growth. For this reason, it is important for organizations to view R&D not as an expense but rather as an investment and asset. The new understanding of R&D as an investment in intellectual property is leading to an increase in GDP and other economic aggregates.
How can the Economic Footprint be applied?
The Economic Footprint provides scientific evidence of the economic impact an organization has. This enables a better understanding of a company’s economic impact – for both internal and external stakeholders. As a standard measure for assessing economic impact, the Economic Footprint also contributes to increased transparency and comparability.
Other applications include:
- Basis for internal and external decision-making
- Comparability at country, regional, and global level
- Measurement of contribution to R&D policy objectives
- Assessment of the contribution to the United Nations’ Sustainable Development Goals
Case study: The Economic and R&D Footprint of the Graphene Flagship Project
In a study, WifOR investigated the economic impact of the Graphene Flagship Project within Europe and globally. The study quantifies the Economic and R&D Footprint, measured as gross value added and jobs supported through the project’s research and development (R&D) as well as related business activities from 2014 to 2030.
The Graphene Flagship Project
Graphene is a carbon-based material with exceptional physical and engineering properties. It has numerous applications in energy, construction, healthcare, transportation, and electronics. The Graphene Flagship is a collaborative research and innovation project initiated to develop the market for the use of graphene and related products. For this, academic and industrial researchers were brought together to develop and commercialize new technologies based on graphene and related layered materials.
The project began in October 2013 and was one of the first two Future Emerging Technologies (FET) Flagships launched by the European Commission. Since its launch, it has been funded by both the European Commission and EU Member States and Associated Countries.


Presentation of the study
The project’s activities resulted in a high economic contribution and created new employment opportunities in Europe and beyond. The aim of the study was to estimate the economic impact of the Graphene Flagship Project in Europe and globally since its launch, including its market share and projection up until 2030. WifOR spoke with Jari Kinaret, Director of the Graphene Flagship Project, about the lessons learned and the impact the study has had.
1. What led you to commission the study measuring the Economic and R&D Footprint of graphene?
Accurately measuring the impact of a publicly funded research activity is quite complicated and, according to academic studies, can only be done 10-15 years after the activity is completed. We wanted to see what could be done earlier and sought an external party with expertise in this area.
2. For our readers, could you outline the most important steps of the collaboration process with WifOR from your perspective?
The collaboration process with WifOR involved a series of key steps from our perspective. The process began as a dialogue between us, on the Flagship Project, and WifOR to determine what could be achieved within the timeframe and budget. Then, it was essential to establish a mutual understanding of how WifOR’s methods could be effectively applied to a complex project like the Graphene Flagship. This project involved a vast network of over 170 partners and 100 associated members across various branches, spanning more than 20 countries. These initial steps laid the foundation for our successful collaboration.
3. How will you use the results?
We will use them primarily as a component in reporting the impact of the Graphene Flagship. As a first step, the results will be incorporated into a report that we will submit to the European Commission. Later, they will become part of a report that we will prepare together with the European Commission and external parties.

Jari Kinaret
Director of the Graphene Flagship Project
WifOR’s study on the Graphene Flagship’s Economic and R&D Footprint provides evidence, first and foremost, that the EU’s investments in the program are paying off in multiple ways – in Europe and worldwide.
4. Why is it important to provide the public with scientific data on the Economic and R&D Footprint of graphene?
The Graphene Flagship project was funded by European taxpayers. It is important that they know what we have achieved with their funds. Impact analysis can be used to evaluate the performance of different funding mechanisms and help policymakers develop best practices to address future challenges.
5. How could the results of the study influence the decisions of the Graphene Flagship Project in the future?
Due to decision deadlines in European politics, it might be difficult to use these results directly for the next steps. Most of the decisions for the next years have already been made. However, in the longer term, results may influence future funding decisions. This can perhaps help secure continued support for research and innovation based on two-dimensional materials.
6. What impact do you think the project will have on industry standards?
The main goal of the Graphene Flagship Project is to industrialize technologies based on graphene and related materials. This requires, among other factors, that industrial players and decision-makers develop confidence in the new technology. To support this confidence, we can demonstrate concrete impacts. WifOR’s study will contribute to this goal.
Thank you very much for the interview!